Does a tougher sixth-form entry bar mean better A-level results?
Most grammar schools admit outside students into the sixth form, and each sets its own GCSE hurdle to get in. We turned every school’s published requirement into a single comparable number, then joined it to their official A-level results across 159 grammar schools. A higher bar really does track higher raw results. What it doesn’t track is how much a school adds.
Three numbers that sum it up.
Turning a page of small print into one number.
Nearly every grammar school runs a sixth form that admits students from other schools at 16, and each publishes its own academic hurdle to get in. But those hurdles are written in wildly different currencies. One school asks for “48 points across your best 8 GCSEs”; another wants “six GCSEs at grade 6”; a third sets an “Attainment 8 score of 60”; a fourth simply says “an average of grade 6.” You can’t compare them at a glance.
So we converted each one to a common yardstick: the average GCSE grade it implies across a pupil’s best eight subjects. A 48-point best-8 requirement is a grade-6 average (48 ÷ 8); an Attainment 8 of 60 is about the same; “five GCSEs at grade 5” sits near a grade-5 floor. That gives one number (call it the entry bar) that runs from roughly grade 4 at the most open sixth forms to grade 7-plus at the most demanding.
Then we asked the obvious question: does a higher bar go with better A-level results? We joined the entry bar for all 159 grammar schools that publish a numeric requirement and have published A-level data to their latest DfE figures: average A-level points, and the intake-adjusted value-added score.
Raw results climb with the bar: a clean staircase.
Group the schools by their entry bar and the raw A-level results rise step by step. Schools whose bar works out to a grade-4 average post about 35 A-level points on average; those demanding a grade-7 average post about 45. That’s a big gap (the equivalent of a whole grade across three A-levels), and the correlation across all 159 schools is a strong 0.61.
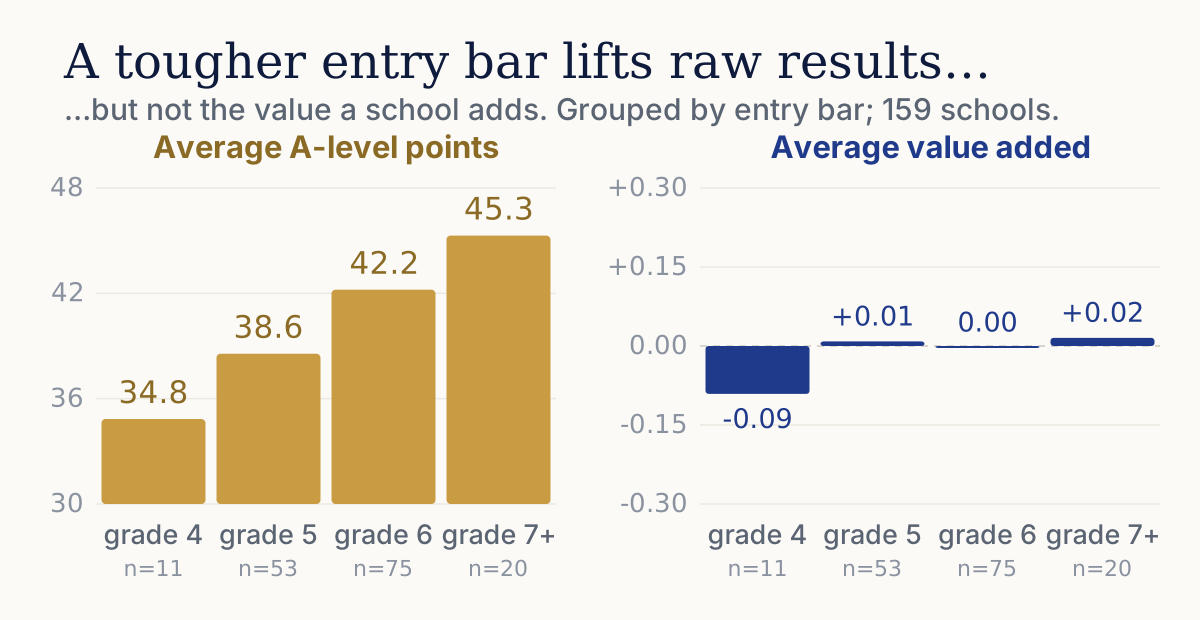
Look at the right-hand panel, though, and the staircase vanishes. Value added, how far pupils progress between GCSE and A-level, compared with similar pupils nationally, is essentially flat across every band, hovering around zero whether the bar is grade 4 or grade 7. The correlation between the entry bar and value added is just 0.09: statistically, nothing.
Same tough bar, wildly different results.
Plot every school as a dot (entry bar across, A-level points up), and the upward drift is unmistakable. But look at any single vertical slice and the spread is enormous. Averages hide the most useful fact for a parent: even among the schools with the toughest entry bar, outcomes are all over the map, running the full national grammar range.
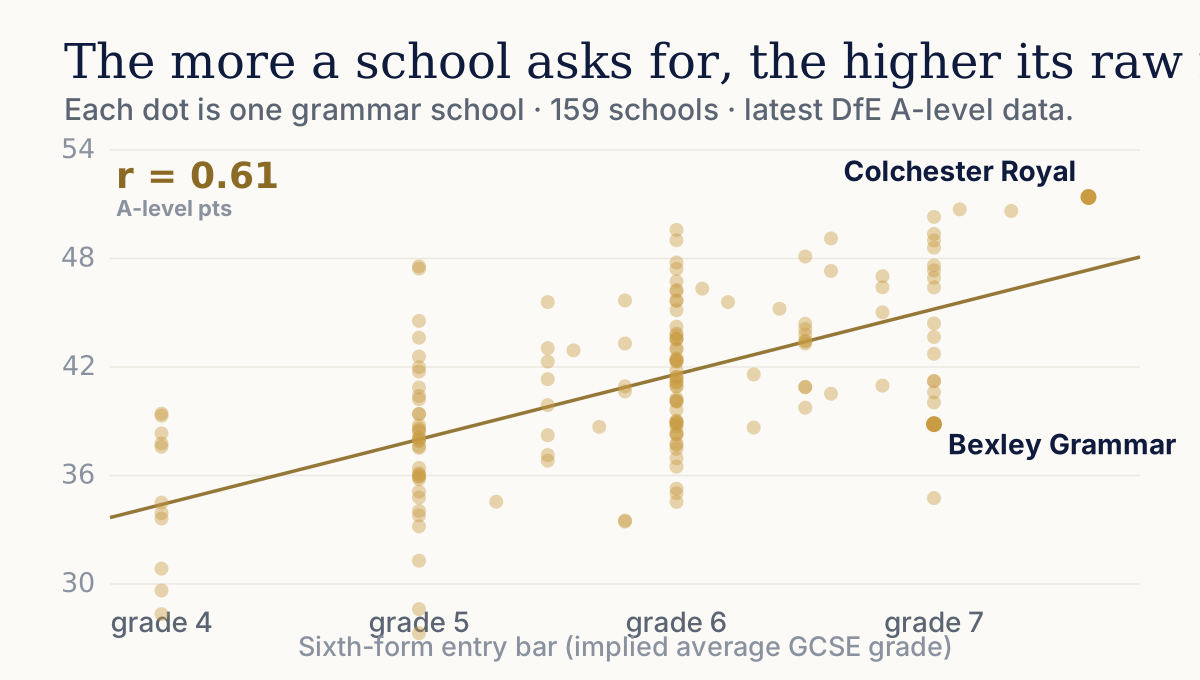
Take the schools whose bar works out to roughly a grade-7 average, the most demanding group: Colchester Royal turns that hurdle into 51 A-level points while Bexley Grammar (an identical bar) posts 39. The entry requirement told you these schools admit strong pupils. It did not tell you which would go on to strong A-level grades.
The schools that add the most set a modest bar.
Swap the vertical axis for value added and the cloud goes flat: the trend line barely tilts (correlation 0.09), and schools at every entry bar scatter above and below the national average alike. If the bar predicted value added, the schools that lift their pupils furthest would cluster on the right. They don’t.
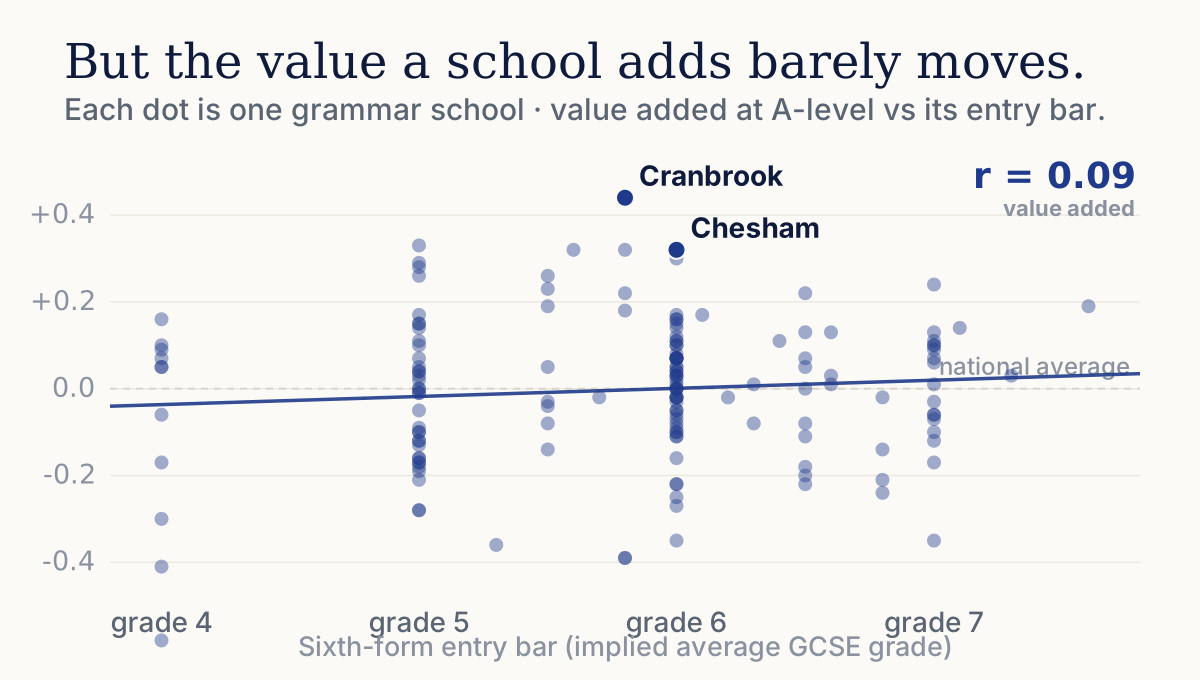
The grammar schools with the highest A-level value added: Cranbrook, St Anselm’s College, Chesham Grammar, the Royal Latin School, The King’s School Grantham and Ripon Grammar, mostly set only a grade-5 to grade-6 bar. Chesham and the Royal Latin School even reach A-grade A-level averages off a grade-6 requirement, matching or beating some of the grade-7 schools. A moderate entry bar is not a sign of a weaker sixth form; in several of the strongest-adding schools it is exactly the opposite.
How to use a sixth-form entry requirement.
Use the bar to gauge your child’s chances, not the school’s quality. The entry requirement is a genuinely useful planning tool: it tells you what GCSE grades your child realistically needs to be offered a place, and how much competition to expect. A school asking for 57 best-8 points is a different proposition from one asking for five grade-5s.
Don’t read a high bar as “better school.” The demanding requirement mostly signals a strong intake, which flatters the raw results. On the measure that isolates the school’s own contribution (value added) the entry bar carries almost no information. Judge the sixth form on its value added and its results for pupils like yours, not on how hard it is to get in.
Look past the headline number for hidden value. Some of the strongest-adding sixth forms (Cranbrook, Chesham, the Royal Latin School, Ripon) set only a moderate bar. Shopping by entry requirement alone would filter them out.
See every school’s sixth-form requirement, and its results
Each school’s sixth-form entry bar, A-level results and value added, for any postcode in England.
Or browse the national rankings to compare A-level results side by side.
How we did this.
- The entry bar. Every grammar school’s published sixth-form entry requirement, taken from its admissions guide or policy, converted to an implied average GCSE grade across a pupil’s best 8 subjects: a best-8 points total is divided by 8; an average-points requirement is used directly; an Attainment 8 score is divided by ten; a count of GCSEs at a grade uses that floor grade.
- Results. Latest available year from official DfE / Ofsted data: average A-level points and the KS5 value-added score. Figures are school-level averages.
- Coverage. 159 grammar schools with both a numeric entry requirement and published A-level results. A handful are excluded because they publish no numeric bar: admitting by head-teacher recommendation, or deferring to an annual prospectus figure that is not public.
- Caveats. This is a correlation across schools, not a controlled experiment. The implied-grade conversion flattens genuinely different requirements onto one scale, and a “count of GCSEs” floor is a rougher proxy than a points total. Value added at KS5 is a noisier measure than at KS4 and is itself imperfect. Read the direction of the findings (strong link to raw results, negligible link to value added) rather than any single school’s decimal.
The wider evidence.
Our entry-bar analysis is original, but it echoes a well-established theme in the research: raw school results are dominated by intake, and only intake-adjusted measures speak to what a school itself contributes.
- Education Policy Institute (2016): Grammar schools: 8 conclusions from the data Once prior attainment is controlled for, grammar pupils do little better than similar pupils elsewhere. The same “raw results are mostly selection” point that separates our two columns.
- FFT Education Datalab (2016): Progress 8 is too favourable to grammar schools Why value-added measures for high-attaining intakes should be read with care: context for treating the value-added figures as directional, not decisive.
- Department for Education (RR038): The effect of changes in published secondary-school admissions on pupil composition Admissions rules measurably shape who a school admits: the mechanism that turns a tougher entry bar into a stronger intake and higher raw results.